Riccardo Gismondi – Hannes Leo – Alfred Taudes
Life Cycles Assessment (LCA) tries to evaluate the environmental impact of products, processes or services throughout its entire life cycle, accounting for the input raw materials, energy used in extraction, production, distribution, use and disposal as well as the emission and environmental impacts during consumption and deposition. Given the complexity of production processes, methodological choices, system boundaries and the related decisions to be taken, many researchers and practitioners doubt the applicability of this method for day to day decisions (see Clune, 2017 for an overview).
Still, the LCA is regularly used to evaluate the impact on energy consumption, greenhouse gas emissions, water consumption, biodiversity and disposal. The alternative, focussing on subsystems – even if they come with well defined properties and boundaries – would be an even worse choice as the results would solely depend on the chosen fraction of the overall impact generating process. While arriving at the one true value for the cradle to grave impact of a product/service/process is obviously impossible, striving for it and dealing with imperfect estimates is the only meaningful alternative.
While LCA databases are already used to analyse the impact of individual food products and the food sector overall, missing or inconsistent values for fresh food are seen as a major problem for a comprehensive climate footprint labelling of the products on offer. Clune et al. (2017) somewhat closed this gap by collecting more than 500 LCA studies that contain GHG emission estimates for almost 1700 fresh products. This is a good starting point to reflect on methodological obstacles that prevent the use of LCA derived emission data and impact scores in day to day decisions by consumers, restaurant owners, cooks or public procurement decision makers.
The CO2-equivalents for each product diverge substantially as is argued by critics of this approach (see figure 1a and 1b). Plant-based products emit between 0 and more than 7 kg of CO2eq per kilo of the product. The median estimate – i.e. the estimate in the middle if all estimates are ranked according to size – is about 0.5kg. This is distinctly different from zero but only 1/16 of the maximum estimate for plant products. The 7 kilo emitting plant is not an avocado – as you might have guessed – but greenhouse grown berries. Despite its bad reputation, avocados produce slightly more than one kilo of CO2 per kilo if they are produced in Peru and consumed in Germany (see figure 2; you may explore this and more estimates on the LiveLCA.com page). If eating nothing but 2.43kg of avocados per day keeps you happy, you would just about exhaust your daily food related CO2 budget. Formulated differently, your consumption pattern would keep you within the limits of international climate agreements even if you feed solely on the much “maligned” avocados.
Figure 1a: Distribution of CO2eq emissions per kilogram of plants
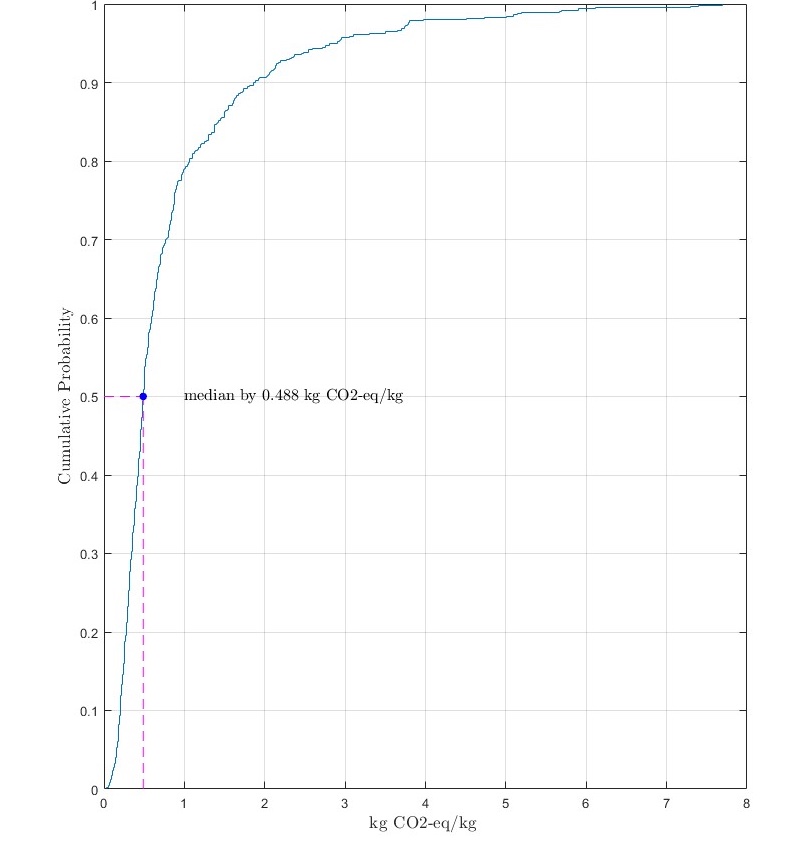
Figure 1b: Distribution of CO2eq emissions per kilogram animal-based products
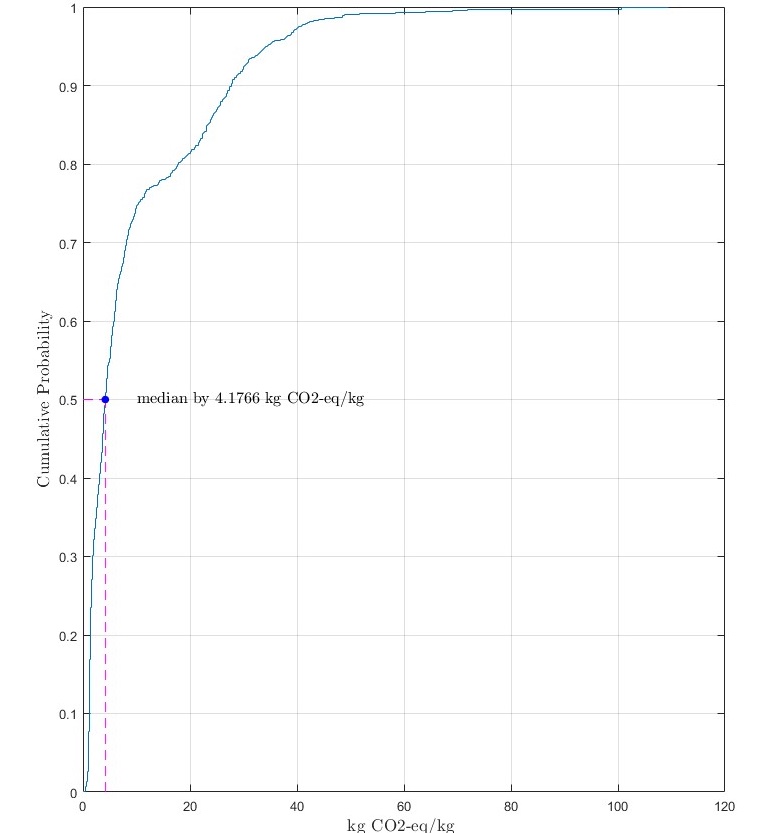
Source: Own calculations based on data from Clune et al. (2017).
Figure 2: Spotlight on avocados
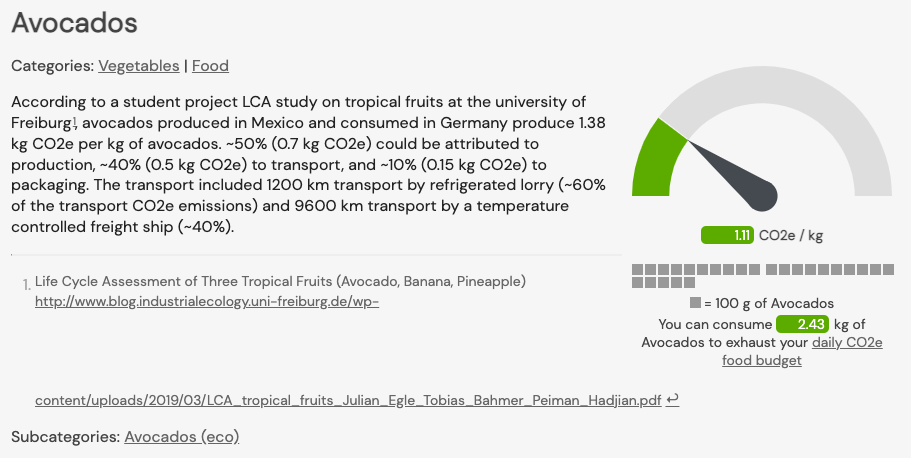
Source: https://livelca.com/products/avocados_a4baf62f-86f6-422e-8136-53eee0a08203
While avocados are better than their reputation – at least in terms of CO2 emissions -, animal products are not as is visible in figure 1b: the median emissions per kg of animal products is 4.2 kg CO2eq in this collection of LCA studies. Based on the average CO2 emissions of 14.24 kg per kg of meat (see livelca.com), staying within stated climate targets would demand that you eat no more than 0.19 kg meat per day without any (!) side-dishes. You would then consume about 70 kg of meat per year which is not much above the European average. This causes food-based CO2 emission of slightly less than a tonne per year. While this meat-only diet would keep your CO2 emissions at a justifiable level, the overall impact on your health would be devastating. To avoid this outcome, the experts of the Lancet Commission (2019) developed the dietary recommendations which respect the boundaries of the planet and the need to provide healthy food for a still growing world population. In terms of meat intake this diet recommends a steep reduction to about 15kg per year.
Anyway, if CO2 emissions are concerned, there is a strong boundary between the plant and animal kingdom. The median CO2 estimate for plants is 0,5 kg CO2 emissions per kg of the product. For ruminants (e.g. beef, lamb) the median emissions are more than 26 kg of CO2eq. Dairy, fish, poultry and non-ruminants emit far less CO2eq per kilo than ruminants but significantly more than plants, concretely, about 3 times for dairy, 7 for poultry, 8 for fish, 12 for non-ruminants, and 52 for ruminants.
Table 1: CO2 emission for different subsets of the surveyed LCA studies
Source: Own calculations based on data from Clune et al. (2017).
Still there are many tricky choices to be made when making dietary decisions. Different LCA values for the same product make it difficult to decide between different products (see table 2). This is made obvious by an assessment of the variation within categories. Surprisingly this is largest for plants:
The CO2 emissions of the top1% plants are 70 times higher than those of the bottom 1%. This huge difference is due to differences in CO2 emission patterns across plants, the way they are produced, where they are produced, how they are transported etc. as well as methodological differences, individual decisions during the analysis, measuring errors etc. For plants, producing them in glasshouses seems to be the biggest impact factor as almost all LCA values at the high end of the distribution are for glasshouse grown plants.
This spread is also considerable for dairy – 30. In this category, milk clusters at the lower end while butter and hard cheese are on the higher end of the distribution and therefore responsible for the large bandwidth of CO2 emissions for dairy products.
The spread for fish is 34. Here the way of fishing, the distances covered, the production and delivery mode (frozen vs. fresh vs. in containers) and methodological differences are partly explaining the wide variations.
The difference between low and high emitting food is rather low within the non-ruminant (7), poultry (7) and ruminant (10) categories.
In absolute terms the differences are almost negligible in the plants category but substantial in all other categories. In the extreme, 1 kg of beef may come with a CO2eq. of either 10 or 100 kg depending on the factors already mentioned.
Table 2: Within category and between category spread of estimates
* Emission Reduction Factor (ERF)= Emissions of 3rd quartile of category xEmissions of 3rd quartile of plants , rounded
An ERF of 2 means the emissions could be halved by substitution this food category by plants.
Source: Own calculations based on data from Clune et al. (2017).
Practitioners deal with the large differences for LCA estimates by cutting off extreme values and relying on the median, average or the first and third quartile. Clune et al. (2017) demonstrate that the latter approach works well by calculating the difference between a diet based on Australian consumption patterns, an alternative diet where meats were substituted by less CO2 emitting substitutes, and a mostly plant-based diet. They were using the 1st quartile, the median and the quartile for their calculations. If CO2 emissions are to be reduced, the plant-based diet outperforms the other options by a wide margin.
Aside from restoring the applicability of LCAs in decision making even if fresh products are concerned, this points to huge between category differences. If plants (i.e. 1st percentile) are the default value, the top 99% percentile of ruminant products emit 1007 times more CO2eq per kilo. The corresponding values for fish are 325, for non-ruminants 195, dairy 132 and poultry 86. The more moderate comparison – i.e. because of dropping extreme values – is by using the CO2 emission of the first quartile of plants and comparing it to the 3rd quartile of the other categories. Still the multiples for other categories emissions are substantial: the third quartile of ruminants emits 111 times more CO2eq than the first of plants, fish and non-ruminants score 22 multiples, poultry 17 and dairy 6. The low multiple of dairy is due to the overrepresentation of LCA studies for milk (more than 250) in this category.
Where does this discussion of CO2 emission for fresh products leave us? Are LCA values in any way informative if dietary decisions have to be made? If not – surprisingly the conclusion at which we will arrive – then in what insights are to be taken?
In general, plants emit the least CO2 per kg and should thus be the default option if the climate impact of diets is to be reduced. This rule is reinforced by the negative health and biodiversity impact, the large environmental pollution, and huge water and energy consumption of animal-based products. This holds even if the lower end of the CO2 emission distribution of animal-based products is used for the comparison and gets even stronger if animal welfare criteria are added to the calculations.
The differences within animal-based food categories are considerable too. Obviously, ruminants (e.g. beef, lamp, sheep) come with significantly higher CO2 emissions than non-ruminants, poultry and fish. Prioritising the latter in the composition of the suggested 15kg annual meat intake is the obvious choice when reducing the climate impact of diets. The same holds for dairy products where butter and cheese are on the high end of the distribution while milk is on the low end. Still switching to plant-based milk can reduce CO2 emissions further.
Even within product categories like milk or kiwis differences are substantial. Some of them are easily explained – glasshouse vs. open land productions – while others are more difficult to fathom. As this problem is most pressing for fresh products – and we use only LCA data for fresh products here – calculating a range between the first and third quartile is a reasonable compromise that can be used to get estimates that are sufficient to make well-informed decisions. Given that there are always methodological differences and – equally important – differences in the individual decisions taken by researchers in the assessment process, too much emphasis on analytical precision of results is counterproductive. Consequently, simple guidelines suffice.
The most important insight is that rather than looking at within category differences the differences between categories are key for strategies to reduce the individual or food system food print. “Veganising” strategies do cause huge reduction in GHG emissions. Replacing milk by something plant-based reduces CO2 emissions by half; the corresponding emission reduction factor for ruminants is 37 meaning that replacing one kg of ruminant meat by 1kg of plants will reduce emissions to 1/37th of ruminants emissions. Given that there is already a large number of plant-based substitutes available, this strategy allows for huge reductions in CO2 emissions.
The latter also holds for communal catering and restaurants. The shift towards plant-based diets is most important. Still, accounting for carbon emissions is important to assess if the offering is aligned with climate goals and as well as in gauging change processes. Without being able to measure the status quo as well as the change, processes will miss momentum and may regress towards “old habits”.
There is a substantial number of databases that provide LCA-based values for non-fresh foods not only for CO2eq emissions but also environmental impact scores, health benefits etc. For example, Open Food Facts is an open source database that crowdsources the ingredients of food products and adds climate and environment data allowing for informed buying decisions of consumers that use their mobile app. Likewise the mobile app of Inoqo provides an assessment of the impact of food products and is also available for download.
While there are few efforts to bring the food system in line with climate right now, this will have to change if humanity is to avoid the breakdown of the biosphere. This is particularly obvious for public sector actors which are both the regulators of the system as well as providers of food services in schools, retiree homes, hospitals, military etc. as well as for their employees. It is often forgotten that the climate and biodiversity treaties signed are being clearly violated by the present state of the food system as well as the offering in public canteen or the public procurement decisions taken. The rule of law as well as honouring signed contracts is not a decision variable for public sector actors.
Last but not least, we were focussing only on the climate impact of food and used data for fresh products only. Making decisions in this field is, of course, more complex as the health, environment, biodiversity, water and land use etc. impacts of the food system have to be taken into account too. Furthermore, the preferential buying of regional and/or organic products are also important decision variables. Building decision systems that adequately deal with the multifaceted nature of the food system and its impact are not a trivial challenge. The considerable confusion about what to prioritise and how to deal with the transformation in agriculture that may be the result of changes on the demand side further adds to this challenge.
We think that many decisions that concern the food system were not evidence-based – to say the least – but based on traditional views, cultural preferences, influenced by lobby groups, slowed down by inert consumers, missing alternatives/substitutes and reluctant and captured regulators (see also our blog on dietary guidelines). Still – on the positive side – the root cause of most negative impacts is more than obvious: it’s the overproduction and overconsumption of animal products. So while the food system is highly complex, the overall direction – reducing the intake of animal products – is hard to dispute.
Literature
The Lancet Commission, Food in the Anthropocene: the EAT–Lancet Commission on healthy diets from sustainable food systems, 2019, https://www.thelancet.com/action/showPdf?pii=S0140-6736%2818%2931788-4
Clune, S., Crossin, E., Verghese, K., Systematic review of greenhouse gas emissions for different fresh food categories, Journal of Greener Production, 140, 2017, http://dx.doi.org/10.1016/j.jclepro.2016.04.082